I am trying to obtain a corrplot of some three-dimensional data array using Julia. The StatsPlots documentation includes the following example of a corrplot:
M = randn(1000,4)
M[:,2] .+= 0.8sqrt.(abs.(M[:,1])) .- 0.5M[:,3] .+ 5
M[:,3] .-= 0.7M[:,1].^2 .+ 2
corrplot(M, label = ["x$i" for i=1:4])
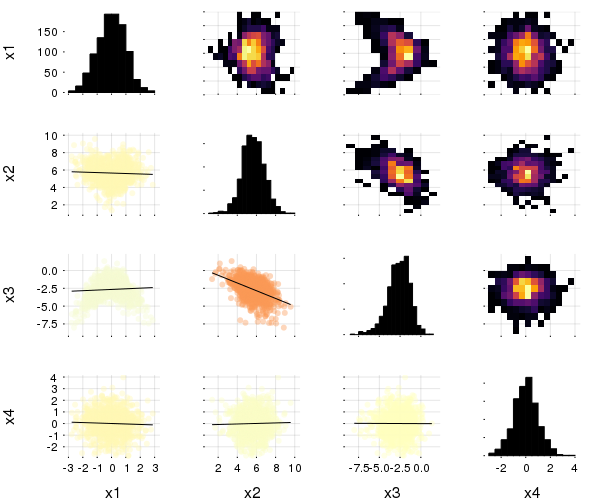
However, when I try to run the same script, I obtain flat histograms (no color gradient):

I generated the previous figure with the following script:
using StatsPlots
gr()
M = randn(1000,4)
M[:,2] .+= 0.8sqrt.(abs.(M[:,1])) .- 0.5M[:,3] .+ 5
M[:,3] .-= 0.7M[:,1].^2 .+ 2
corrplot(M, label = ["x$i" for i=1:4])
savefig("corrplot_example.png")
I am not sure what I am doing differently. My Julia version is 1.3.1, and my StatsPlots version is 0.14.6.