In a Java threaddump I found the following:
"TP-Processor184" daemon prio=10 tid=0x00007f2a7c056800 nid=0x47e7 waiting for monitor entry [0x00007f2a21278000]
   java.lang.Thread.State: BLOCKED (on object monitor)
    at org.apache.jackrabbit.core.state.SharedItemStateManager.getNonVirtualItemState(SharedItemStateManager.java:1725)
    - locked <0x0000000682f99d98> (a org.apache.jackrabbit.core.state.SharedItemStateManager)
    at org.apache.jackrabbit.core.state.SharedItemStateManager.getItemState(SharedItemStateManager.java:257)

"TP-Processor137" daemon prio=10 tid=0x00007f2a7c00f800 nid=0x4131 waiting for monitor entry [0x00007f2a1ace7000]
   java.lang.Thread.State: BLOCKED (on object monitor)
    at org.apache.jackrabbit.core.state.SharedItemStateManager.getNonVirtualItemState(SharedItemStateManager.java:1725)
    - locked <0x0000000682f99d98> (a org.apache.jackrabbit.core.state.SharedItemStateManager)
    at org.apache.jackrabbit.core.state.SharedItemStateManager.getItemState(SharedItemStateManager.java:257)
The point here being that both threads have locked monitor <0x0000000682f99d98> (regardless of them now waiting for two different other monitors).
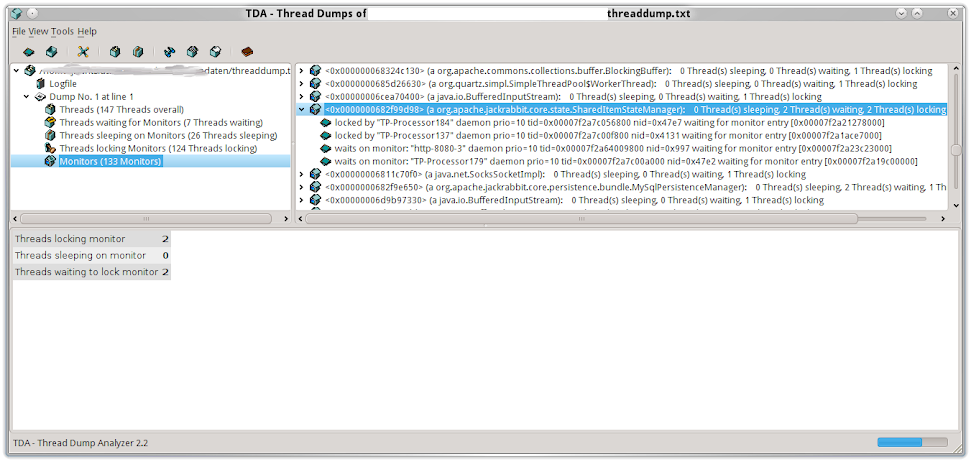
When looking at Thread Dump Analyzer, with that monitor being selected, it really says "Threads locking monitor: 2" at the bottom, and "2 Thread(s) locking". Please see https://lh4.googleusercontent.com/-fCmlnohVqE0/T1D5lcPerZI/AAAAAAAAD2c/vAHcDiGOoMo/s971/locked_by_two_threads_3.png for the screenshot, I'm not allowed to paste images here.
Does this mean threaddumps aren't atomic with respect to monitor lock information? I can't imagine this really being a locking bug of the JVM (1.6.0_26-b03).
A similar question has already been asked in Can several threads hold a lock on the same monitor in Java?, but the answer to me didn't see the real point of multiple threads locking the same monitor, even though they may be waiting for some other.
Update May 13th 2014:
Newer question Multiple threads hold the same lock? has code to reproduce the behaviour, and @rsxg has filed an according bug report https://bugs.openjdk.java.net/browse/JDK-8036823 along the lines of his answer here.

You are probably running into a cosmetic bug in the stack trace routines in the JVM when analyzing heavily contended locks - it may or may not be the same as this bug.
The fact is that neither of your two threads have actually managed to acquire the lock on the
SharedItemStateManager, as you can see from the fact that they are reportingwaiting for monitor entry. The bug is that further up in the stack trace in both cases they should reportwaiting to lockinstead oflocked.The workaround when analyzing strange stack traces like this is to always check that a thread claiming to have
lockedan object is not also waiting to acquire a lock on the same object.(Unfortunately this analysis requires cross-referencing the line numbers in the stack trace with the source, code since there is no relationship between the figures in the
waiting for monitor entryheader and thelockedline in the stack trace. As per this Oracle document, the number0x00007f2a21278000in the lineTP-Processor184" daemon prio=10 tid=0x00007f2a7c056800 nid=0x47e7 waiting for monitor entry [0x00007f2a21278000]refers to an estimate of the valid stack region for the thread. So it looks like a monitor ID but it isn't - and you can see that the two threads you gave are at different addresses in the stack).