I am measuring my website's performance on the basis of performance object provided by HTML5 and I want to know that what is going wrong with my application, I also want to log these performance object of other end users in my local database so that I have information from theirs sides, but I am not quite familiar with what every property means, like what could be the reason of delay in connectStart, connectEnd ... I have created a map as per my knowledge but I need input from community for this ... this would be quite helpful for other people to know aswell
var issueList = {
    'connectStart':         'Network issue',
    'connectEnd':           'Server is not responding fast with SSL handshake',
    'domainLookupStart':    'Network issue',
    'domainLookupEnd':      'Network issue',
    'fetchStart':           'Slow browser',
    'redirectStart':        'Network issue',
    'redirectEnd':          'Busy server',
    'requestStart':         'Network issue',
    'responseStart':        'Server is slow',
    'domLoading':           'Low internet bandwidth',
    'unloadEventStart':     'Slow browser',
    'unloadEventEnd':       'Slow browser, browser processes are too heavy',
    'navigationStart':      'Slow browser',
    'responseEnd':          'Network issue',
    'domInteractive':       'Browser issue',
    'domContentLoadedEventStart':   'Network issue',
    'domContentLoadedEventEnd':     'Network issue',
    'domComplete':          'Too much DOM manipulation',
    'loadEventStart':       'Unknown',
    'loadEventEnd':         'Low JS performance, either not optimized JS or browser is slow'
};
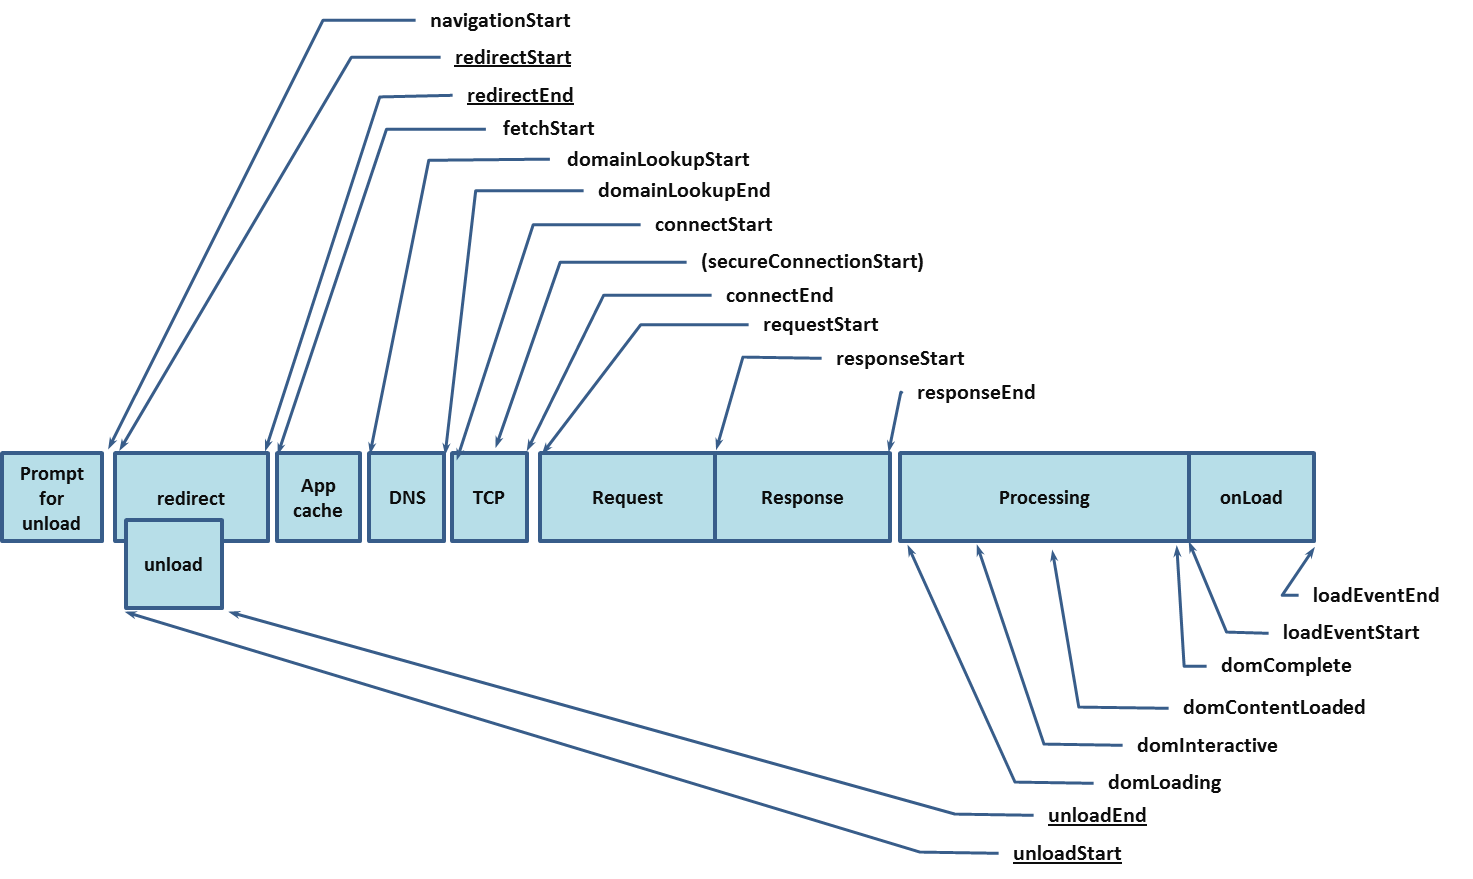
Sequence of the process is shown in this image for information

I have also created a JSFiddle for this
Same way, I also want to measure performance of AJAX request in my webpage and I am thinking of using readyState of AJAX Requests So I want to know what could be the reason there for taking time between every state change
State  Description                     Reason
0      The request is not initialized  Slow JS execution
1      The request has been set up     Slow JS execution
2      The request has been sent       Slow Netowkr Connection
3      The request is in process       Slow Server response
4      The request is complete         Slow server processing
The reason behind I want to do this is because, Sometimes we got a complaint that our application is being a bit slow, So in those cases we can read that user's performance object and also read overall performance object. we can also read various performance objects while peak use of our application and other times aswell and want to measure that which part of the application is taking longer time to load . at the same time it is a product which is going to evolve with a time so for future reference I can also use this data as benchmark. so my only focus is understanding this object completely
Also, Do let me know if there are other ways(If I am taking long route)...

Let's start with this aspect. You don't need to reinvent this all yourself. Your time is much better spent actually improving your site, rather than creating your own monitoring solution.
Google Analytics actually tracks the timing object for you, so you can just check it there. New Relic also does this, and is more developer focused, tracking server-side things as well. There are probably 100 others you could pick from.
The canonical definition for these is the W3C recommendation: https://www.w3.org/TR/navigation-timing/
I suggest not creating such a map, at least in the way you've defined it so far. Each event means something specific. Assuming that a redirect has anything to do with a network issue or busy server makes no sense. Sure, a slow redirect could be due to these items... but it could be due to 100 other things or maybe even intended. Also consider that network conditions widely vary around the world. In short, the definitions as-is are the best.
If you have a specific question about the meaning, and if the W3C spec isn't clear enough for you, I recommend asking a specific question about a specific item you are confused by.