I'm a university student, and r programming beginner. I have a problem when study 'ggplot2' package.
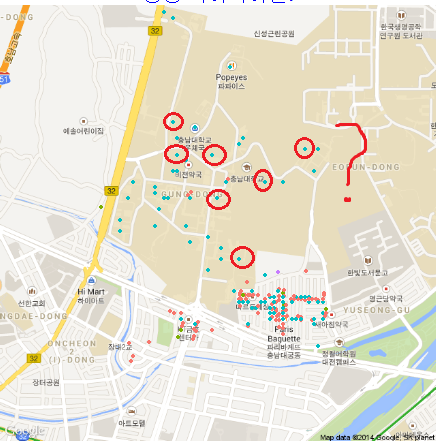
I want plot 'wifi zone' and add circles to a plot, but i cannot do.. and puzzled about what to do..
and I want to know point_geom size that correspond to "wifi zone" real radius '20 meters'.
Data contains latitude, longitude of spot and about what kind of mobile agency is servicing.
My codes as follows :
library(ggmap)

wifi_daejeon <- read.csv("C:/Users/Byeongsoo/Desktop/R markdown/대전와이파이.csv")
wifi_gungdong <- subset(wifi_daejeon, EMD_NM == "궁동")
cent_gungdong <- c(mean(wifi_gungdong$LON), mean(wifi_gungdong$LAT))
bmap_gungdong <- ggmap(get_googlemap(center = cent_gungdong, zoom = 15, maptype = "roadmap"),
                       extent = "device",
                       base_layer = ggplot(wifi_gungdong, aes(x = LON, y = LAT, colour = CCB)))
bmap_gungdong +
  geom_point() +
  theme(plot.title = element_text(size = 20, colour = "BLUE"),
  axis.text = (element_text(size=10))) +
  theme(legend.title = element_text(size = 15)) +
  theme()
unfortunately, i can't upload image, because i don't have 10 reputation..
image's URL is :
http://postfiles4.naver.net/20140318_99/soccerball1_1395130002602k7k10_PNG/%C4%B8%C3%B3.PNG?type=w3
This has been my Question. Thank you for reading up to now.
