Construct ternary grid, evaluate a function on the grid and contour plot in Matlab

4.8k views Asked by At

I need to evaluate a function (say) Fxy = 2*x.^2 +3 *y.^2; on a ternary grid x-range (0 - 1), y-range (0-1) and 1-x-y (0 - 1). I am unable to construct the ternary grid on which I need to evaluate the above function. Also, once evaluated I need to plot the function in a ternary contour plot. Ideally, I need the axes to go counter clockwise in the sense (x -> y--> (1-x-y)).

I have tried the function

function tg = triangle_grid ( n, t )

  ng = ( ( n + 1 ) * ( n + 2 ) ) / 2;
  tg = zeros ( 2, ng );

  p = 0;

  for i = 0 : n
    for j = 0 : n - i
      k = n - i - j;
      p = p + 1;
      tg(1:2,p) = ( i * t(1:2,1) + j * t(1:2,2) + k * t(1:2,3) ) / n;
    end
  end

  return
end

for the number of sub intervals between the triangle edge coordinates

n = 10 (say)

and for the edge coordinates of an equilateral triangle

t = tcoord = [0.0, 0.5,           1.0;
              0.0, 1.0*sqrt(3)/2, 0.0];

This generated a triangular grid with the x-axis from 0-1 but the other two are not from 0-1.

I need something like this:
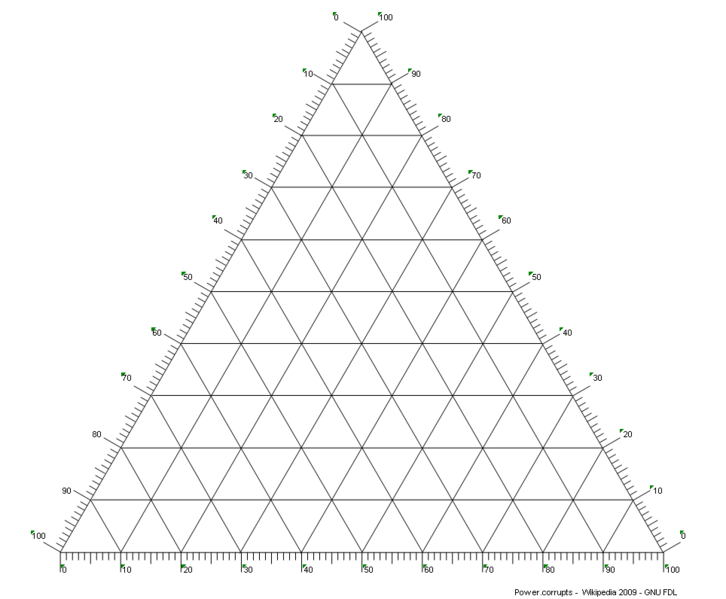
wiki link

... with the axes range 0-1 (0-100 would also do).

In addition, I need to know the coordinate points for all intersections within the triangular grid. Once I have this I can proceed to evaluate the function in this grid.

My final aim is to get something like this. This is a better representation of what I need to achieve (as compared to the previous plot which I have now removed)

better representation

Note that the two ternary plots have iso-value contours which are different in in magnitude. In my case the difference is an order of magnitude, two very different Fxy's.

If I can plot the two ternary plots on top of each other then and evaluate the compositions at the intersection of two iso-value contours on the ternary plane. The compositions should be as read from the ternary plot and not the rectangular grid on which triangle is defined. Currently there are issues (as highlighted in the comments section, will update this once the problem is closer to solution).

3

There are 3 answers

5
chthonicdaemon On BEST ANSWER

I am the author of ternplot. As you have correctly surmised, ternpcolor does not do what you want, as it is built to grid data automatically. In retrospect, this was not a particularly wise decision, I've made a note to change the design. In the mean time this code should do what you want:

EDIT: I've changed the code to find the intersection of two curves rather than just one.

N = 10;
x = linspace(0, 1, N);
y = x;

% The grid intersections on your diagram are actually rectangularly arranged,
% so meshgrid will build the intersections for us
[xx, yy] = meshgrid(x, y);
zz = 1 - (xx + yy);

% now that we've got the intersections, we can evaluate the function
f1 = @(x, y) 2*x.^2 + 3*y.^2 + 0.1;
Fxy1 = f1(xx, yy);
Fxy1(xx + yy > 1) = nan;

f2 = @(x, y) 3*x.^2 + 2*y.^2;
Fxy2 = f2(xx, yy);
Fxy2(xx + yy > 1) = nan;

f3 = @(x, y) (3*x.^2 + 2*y.^2) * 1000; % different order of magnitude
Fxy3 = f3(xx, yy);
Fxy3(xx + yy > 1) = nan;

subplot(1, 2, 1)
% This constructs the ternary axes
ternaxes(5);

% These are the coordinates of the compositions mapped to plot coordinates
[xg, yg] = terncoords(xx, yy);
% simpletri constructs the correct triangles
tri = simpletri(N);

hold on
% and now we can plot
trisurf(tri, xg, yg, Fxy1);
trisurf(tri, xg, yg, Fxy2);
hold off
view([137.5, 30]);

subplot(1, 2, 2);
ternaxes(5)
% Here we plot the line of intersection of the two functions
contour(xg, yg, Fxy1 - Fxy2, [0 0], 'r')
axis equal

enter image description here

EDIT 2: If you want to find the point of intersection between two contours, you are effectively solving two simultaneous equations. This bit of extra code will solve that for you (notice I've used some anonymous functions in the code above now, as well):

f1level = 1;
f3level = 1000;
intersection = fsolve(@(v) [f1(v(1), v(2)) - f1level; f3(v(1), v(2)) - f3level], [0.5, 0.4]);
% if you don't have the optimization toolbox, this command works almost as well
intersection = fminsearch(@(v) sum([f1(v(1), v(2)) - f1level; f3(v(1), v(2)) - f3level].^2), [0.5, 0.4]);

ternaxes(5)
hold on
contour(xg, yg, Fxy1, [f1level f1level]);
contour(xg, yg, Fxy3, [f3level f3level]);
ternplot(intersection(1), intersection(2), 1 - sum(intersection), 'r.');
hold off

enter image description here

7
Ander Biguri On

I have played a bit with the file exchange submission https://www.mathworks.com/matlabcentral/fileexchange/2299-alchemyst-ternplot.

if you just do this:

[x,y]=meshgrid(0:0.1:1);
Fxy = 2*x.^2 +3 *y.^2;
ternpcolor(x(:),y(:),Fxy(:))

You get:

enter image description here

The thirds axis is created exactly as you say (1-x-y) inside the ternpcolor function. There are lots of things to "tune" here but I hope it is enough to get you started.

0
Nicholas Hamilton On

Here is a solution using R and my package ggtern. I have also included the points within proximity underneath, for the purpose of comparison.

library(ggtern)

Fxy      = function(x,y){ 2*x^2 + 3*y^2 }
x = y    = seq(0,1,length.out = 100)
df       = expand.grid(x=x,y=y); 
df$z     = 1 - df$x - df$y
df       = subset(df,z >= 0)
df$value = Fxy(df$x,df$y)

#The Intended Breaks
breaks = pretty(df$value,n=10)

#Create subset of the data, within close proximity to the breaks
df.sub = ldply(breaks,function(b,proximity = 0.02){
  s = b - abs(proximity)/2; f = b + abs(proximity)/2
  subset(df,value >= s & value <= f)
})

#Plot the ternary diagram
ggtern(df,aes(x,y,z)) + 
  theme_bw() + 
  geom_point(data=df.sub,alpha=0.5,color='red',shape=21) + 
  geom_interpolate_tern(aes(value = value,color=..level..), size = 1, n = 200,
                        breaks    = c(breaks,max(df$value) - 0.01,min(df$value) + 0.01),
                        base      = 'identity',
                        formula   = value ~ poly(x,y,degree=2)) +
  labs(title = "Contour Plot on Modelled Surface", x = "Left",y="Top",z="Right")

Which produces the following:

example